For one of our customers we implemented new sales products for their B2B sales portfolio. The products were are sold in the market, but the organisation had difficulties to support the products. Resulting into manual work and work-arounds and a high level of errors in the business chain.
The article shows the position and use of Enterprise architecture in solution design for larger projects in the B2B Energy sales area. And shows the form of different architectures used to implement these products.
To make an accurate impact analysis and an estimation of the work, an Enterprise Architecture model was used. The diagram displays the different layers of the architecture:
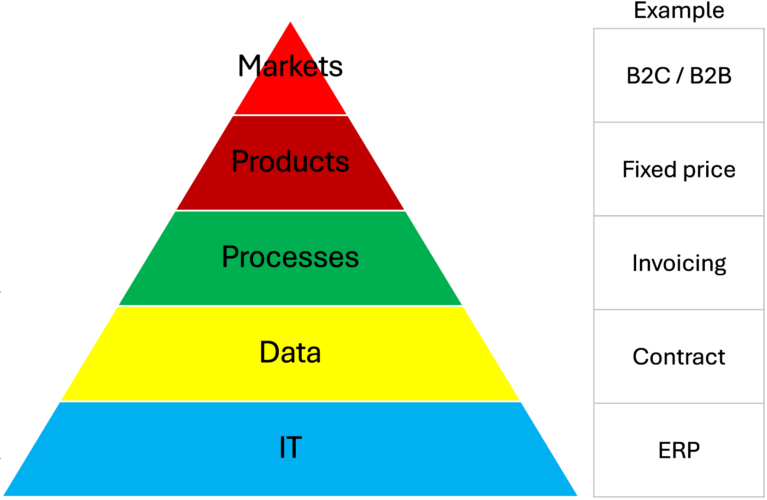
The top layer concerns the market. The starting point of the analysis is the market in which sales products are sold and the segmentation of this market. Additionally, there is the market in which positions are procured, the so-called wholesale market, which can be broken down into different segments such as the Spot Market and the Futures Market.
In both markets, the products are specified. For example, in the B2C and B2B Market, there are well-known products such as fixed-price contracts, variable-price contracts, and spot products. The wholesale market, on the other hand, includes monthly products, yearly products, but also hourly products and imbalance products.
The process follows from the market/product combination, where processes can be generic—applicable to all products—or specific—relevant to only one product. The process architecture itself always consists of different layers, with the top layer being generic and the bottom layer being specific and detailed.
In the data layer, data entities, data attributes, and the various relationships between them are displayed. The data layer also has different levels, with only the highest level represented in the current model.
Ultimately, the model also includes an IT architecture, which is again represented at the highest level in the model. This concerns the IT capabilities within the various main functions of the process, without showing the relationships and interfaces.
This is shown below for the energy sales domain in the Dutch market.

From the product-market combination perspective, the specific features of the Sales products were examined and how they relate to each other and can be combined. A generic proposition was developed for each product, based on which customer-specific agreements can be made within a contract.
The Sales processes support the organisation in providing the customer portfolio with the appropriate communication and ensuring timely invoicing. Additionally, during the contract period, transactions and modifications are exchanged through the ‘My Environment’ portal, and contract terms are monitored.
In the centre of the architecture diagram, the exchange takes place between the purchasing department (Sourcing & Trading) and the sales organisation. Based on volumes and profiles, a request is made for pricing and purchasing of the volumes. This occurs both at an aggregated level as well as for individual customers and even specific transactions.
The Sourcing & Trading process ensures efficient procurement at the lowest possible costs. Additionally, Sourcing & Trading guarantees a ‘full supply’ of the sales portfolio by managing total imbalance and allocations, maintaining market balance, and handling deviations.
The IT systems ensure the automation of the processes and the associated data. The CRM system is used to record customer and contract data; the forecasting system is for creating load forecasts for the portfolio and sometimes individual customers, and the ERP system handles transaction administration and the sending of invoices based on advance payments or consumption data.
Using Enterprise Architecture
The diagram and the underlying structure of the Enterprise architecture clearly shows the implications of changes in the architecture. The pyramid in diagram 1 reflects the different level in which changes can apply. Usually change in the higher area of the pyramid will affect all layers below and changes on the lower level can be executed in more isolation. Entering a new market or selling new / adjusted products will have a higher impact than i.e. extra controls in existing processes.
The Enterprise Architecture diagrams also show the markets and products should be leading in designing the business value chain and processes and IT should be following markets and products.
Eventually the different layers have their own architectural domain. And some examples are provided in the paragraphs below, for information purpose.
Product architecture Level 2
In the table below a short overview of product and product components is provided. This table is a specification of the Sales Product detailed in different components. These Sales products are target for implementation in the architecture describe above.
| Product | Tariff / component | Source | Initial / recurring |
|---|---|---|---|
| Spot price | |||
| Spot delivery | Commodity (Weighted, Unweighted) | ETRM | Recurring (per Month) |
| Add-on (sourcing) GoO, ETS2, Flex Structuring Imbalance | ETRM | Initial (= fixed) | |
| Commercial Margin | CRM | Initial (= fixed) | |
| Partner Fee | CRM | Initial (= fixed) | |
| Spot back delivery | Commodity (Weighted , Unweighted) | ETRM | Recurring (per Month) |
| Add-on (sourcing) | ETRM | Initial (= fixed) | |
| Click | |||
| Click Delivery | Commodity | ETRM | Recurring (per Month) |
| Add-on (sourcing) GoO, ETS2, Flex Structuring Imbalance | ETRM | Initial (= fixed) | |
| Commerciële Marge | CRM | Initial (= fixed) | |
| Partner Fee | CRM | Initial (= fixed) | |
| Split | |||
| Split product (Click + Spot) delivery | Commodity | ETRM | Recurring (per Month) |
| Add-on (sourcing) GoO, ETS2, Flex Structuring Imbalance | ETRM | Initial (= fixed) | |
| Commercial Margin | CRM | Initial (= fixed) | |
| Partner Fee | CRM | Initial (= fixed) | |
| Split product (Click + Spot) back delivery | Commodity: Spot, Weigthed | ETRM | Recurring (per Month) |
| Add-on (sourcing) | ETRM | Initial (= fixed) | |
Process architecture level 2
The process level 2 architecture covers the value chain for the B2B sales activities. It starts with the offering of contracts and prices to potential customers and ends with the invoicing of the consumed power and gas.
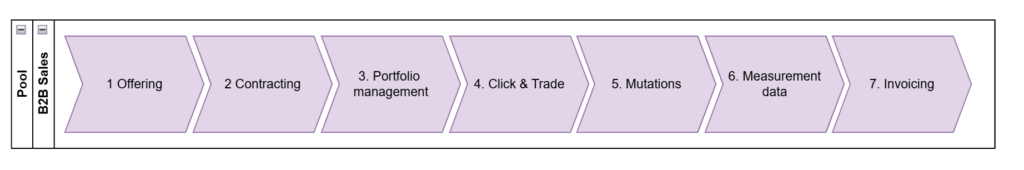
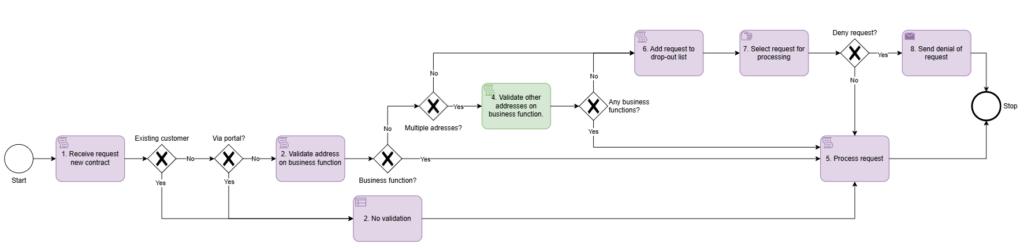
The diagram above shows the main processes sales B2B business model. The diagram below shows a more detailed process flow diagram.
IT architecture level 2
Below is a diagram of the proposed IT architecture supporting the Enterprise architecture.
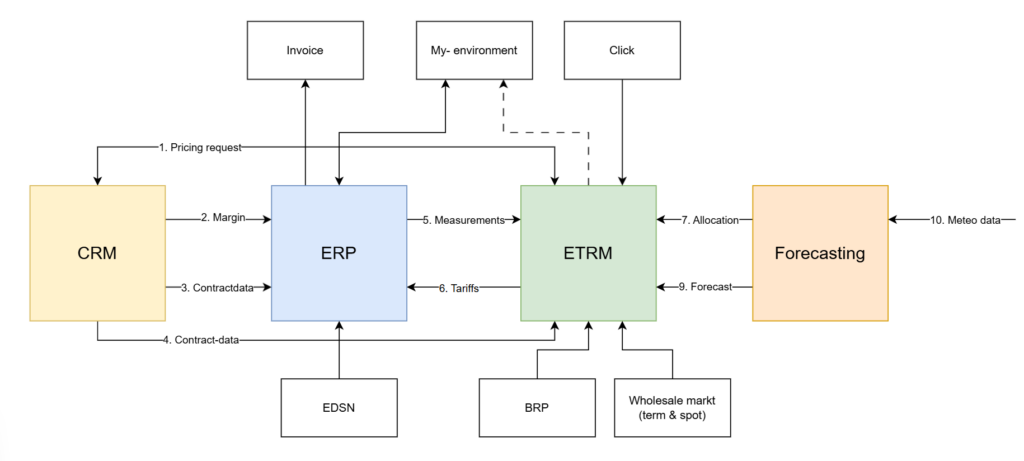
The IT architecture is designed to support both processes and products as designed in the Enterprise architecture